By Arun Menon
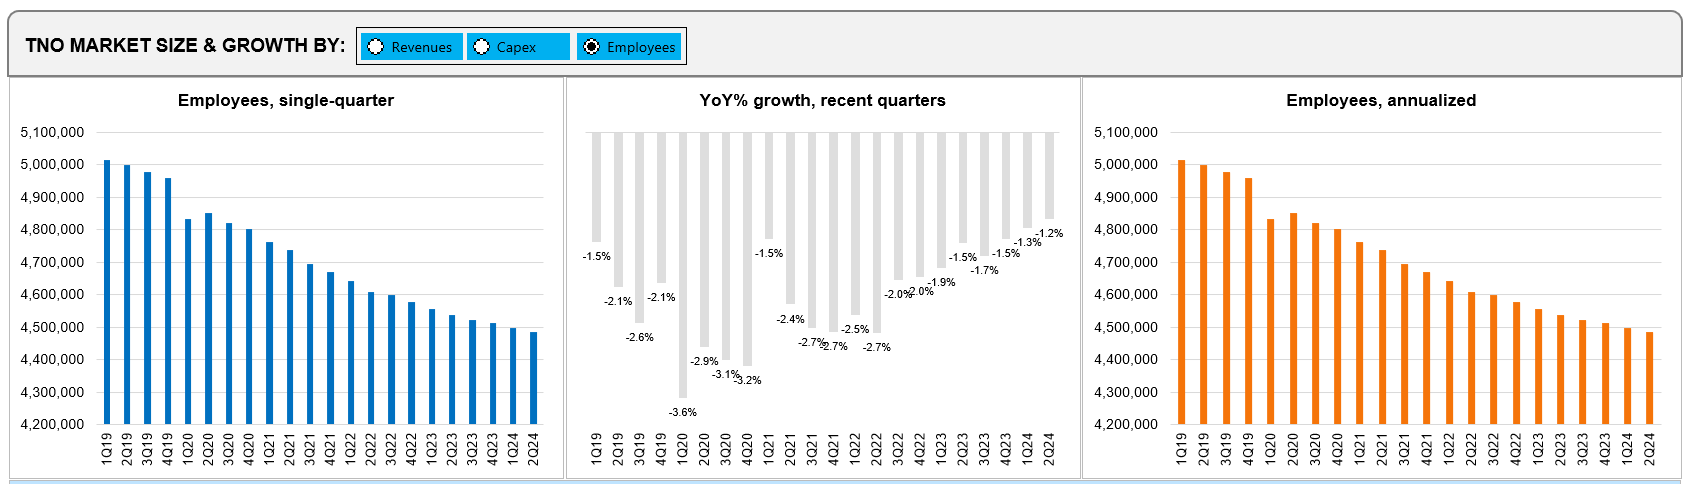
This report reviews the growth and development of the telecommunications network operator (TNO, or telco) market. The report tracks a wide range of financial stats for 140 telcos across the globe, from 1Q11 through 2Q24. For the annualized 2Q24 period, telcos represented $1.77 trillion (T) in revenues (0.1% growth YoY), $262.9 billion (B) in labor costs (2.1% YoY), and $300.7B in capex (-6.9% YoY). They employed approximately 4.48 million people as of June 2024, down 1.2% from the prior year.
Below are the key highlights of the report:
Revenues: Telco topline declined by 1.4% year-over-year (YoY) to reach $437.8 billion (B) in the latest single quarter ending 2Q24. Revenues for the annualized 2Q24 period were $1,768.3B, up 0.1% YoY over the same period in the previous year. At the operator level, five of the top 20 best performing telcos by topline growth in 2Q24 on an annualized basis include America Movil (8.0%), STC (Saudi Telecom) (5.8%), BT (4.7%), Telefonica (3.6%), and Orange (2.9%). By the same criteria, the worst telco growth came from NTT (-5.7%), KDDI (-5.4%), SoftBank (-4.7%), Vodafone (-1.7%), and China Unicom (-1.6%) during the same period.
Capex: Capex spending plunged by 8.0% on a YoY basis to post $69.4B in the latest single quarter ending June 2024. Capex for the annualized 2Q24 period was $300.7B, down 6.9% YoY over the same period in the previous year. At the operator level, five of the top 20 best performing telcos by capex growth in 2Q24 on an annualized basis include BSNL (128.2%), KDDI (23.6%), Telecom Italia (9.1%), Charter Communications (7.9%), and America Movil (7.6%). By the same criteria, the worst capex growth came from Verizon (-26.0%), Reliance Jio (-22.6%), Deutsche Telekom (-20.6%), Vodafone (-14.6%), and AT&T (-13.1%) during the same period.
Opex and labor costs: Total opex for the telecom industry in the annualized 2Q24 period stood at $1,502.7B, a slight increase of 0.4% over the same period previous year. Excluding depreciation and amortization (D&A) costs, total opex increased by 1.2% on YoY basis to record $1,172.2B in the annualized 2Q24 period. One significant element of telco opex is labor costs, which include salaries, wages, bonuses, benefits, and retirement/severance costs. Labor costs grew by 2.1% YoY in the annualized 2Q24 period, pushing labor costs as a percentage of opex (excluding D&A) slightly up from 22.2% in 2Q23 to 22.4% in 2Q24 on an annualized basis. This growth occurred despite an ongoing reduction in industry headcount; the telco workforce ended 2Q24 at 4.48 million, down 1.2% YoY.
Profitability margins: Both EBITDA and EBIT margins experienced a slight uptick in 2Q24 on an annualized basis compared to the previous quarter. Results were mixed when compared to the same period last year. Annualized EBIT margin dipped from 15.3% in 2Q23 to 15.0% in 2Q24, while the EBITDA margin for the annualized 2Q24 period stood at 34.4%, up from 33.7% in annualized 2Q23.
Regional trends: The Americas region outpaced Asia to reclaim its position as the largest region by revenue, holding a 37.3% share in 2Q24. On a capex basis though, the Asia region outspent the Americas, capturing a 36.5% share in the latest quarter. Europe retained the highest annualized capital intensity, reaching 18.4% in 2Q24, followed by MEA at 17.4%.
——————————————————————
Important note: We have made some significant enhancements to our telco market review report in 1Q24. The changes are designed to provide a more insightful and user-friendly experience:
o ‘Market Snapshot’ Tab: This tab now features an interactive dashboard view of the telco market, allowing users to interact with and analyze market data more effectively. Additionally, users can export the dashboard to PDF for convenient sharing and reference.
o Two distinct sections have been created from the previous ‘Company Deepdive & Benchmarking’ section for greater clarity and functionality:
1.‘Company Drilldown’: Provides a comprehensive analysis of a selected company from the full set of 140 telcos. It covers various metrics including revenue, capex, employee counts, costs, profitability, cash and debt levels, and key ratios.
2.‘Company Benchmarking’: Focuses on a sample of 79 telcos, representing approximately 82% of the global market. This section allows users to select and compare up to 5 telcos across multiple metrics such as labor costs, opex, EBIT, as well as revenues, capex, and employee counts. The sample includes operators from all regions and of varying sizes.
Both new sections also feature the capability to export graphics to PDF, enhancing the flexibility and utility of the data presented.
- Table Of Contents
- Figure & Charts
- Coverage
- Visuals
Table Of Contents
- Report Highlights
- Summary
- Market snapshot
- Analysis
- Key stats through 2Q24
- Labor stats
- Operator rankings
- Company drilldown
- Company benchmarking
- Country breakouts
- Country breakouts by company
- Regional breakouts
- Raw Data
- Subs & traffic
- Exchange rates
- Methodology & Scope
- About
Figure & Charts
- TNO market size & growth by: Revenues, Capex, Employees – 1Q19-2Q24
- Regional trends by: Revenues, Capex – 1Q19-2Q24
- Opex & Cost trends
- Labor cost trends: 1Q20-2Q24
- Profitability margin trends: 1Q20-2Q24
- Spending (opex, labor costs, capex): annual and quarterly trend
- Key ratios: annual and quarterly trend
- Workforce & productivity trends: 1Q14-2Q24
- Operator rankings by revenue and capex: latest single-quarter and annualized periods
- Top 20 TNOs by capital intensity: latest single-quarter and annualized periods
- Top 20 TNOs by employee base: latest single-quarter
- TNOs: YoY growth in single quarter revenues
- TNOs: Annualized capital intensity, 1Q16-2Q24
- TNOs: Revenue and RPE, annualized 1Q16-2Q24
- TNOs: Capex and capital intensity (annualized), 1Q16-2Q24
- TNOs: Total headcount trends, 1Q16-2Q24
- TNOs: Revenue and RPE trends, 2011-23
- TNOs: Capex and capital intensity, 2011-23 ($ Mn)
- TNOs: Capex and capital intensity, 1Q16-2Q24 ($ Mn)
- TNOs: Revenue and RPE trends, 1Q16-2Q24
- TNOs by total opex, 2Q24
- TNOs by labor costs, 2Q24
- TNOs: Software as % of total capex
- TNOs: Software & spectrum spend
- TNOs: Total M&A, spectrum and capex (excl. spectrum)
- TNOs by total debt: 2011-23
- TNOs by total net debt: 2011-23
- TNOs by long term debt: 2011-23
- TNOs by short term debt: 2011-23
- TNOs by total cash and short term investments ($M): 2011-23
Coverage
Operator coverage:
| A1 Telekom Austria | Advanced Info Service (AIS) | Airtel | Altice Europe | Altice USA | America Movil | AT&T | Axiata | Axtel | Batelco |
| BCE | Bezeq Israel | Bouygues Telecom | BSNL | BT | Cable ONE, Inc. | Cablevision | Cell C | Cellcom Israel | CenturyLink |
| Cequel Communications | Charter Communications | China Broadcasting Network | China Mobile | China Telecom | China Unicom | Chunghwa Telecom | Cincinatti Bell | CK Hutchison | Clearwire |
| Cogeco | Com Hem Holding AB | Comcast | Consolidated Communications | Cyfrowy Polsat | DEN Networks Limited | Deutsche Telekom | Digi Communications | DirecTV | Dish Network |
| Dish TV India Limited | DNA Ltd. | Du | EE | Elisa | Entel | Etisalat | Fairpoint Communications | Far EasTone Telecommunications Co., Ltd. | Frontier Communications |
| Globe Telecom | Grupo Clarin | Grupo Televisa | Hathway Cable & Datacom Limited | Idea Cellular Limited | Iliad SA | KDDI | KPN | KT | Leap Wireless |
| LG Uplus | Liberty Global | M1 | Manitoba Telecom Services | Maroc Telecom | Maxis Berhad | Megafon | MetroPCS Communications | Millicom | Mobile Telesystems |
| MTN Group | MTNL | NTT | Oi | Omantel | Ono | Ooredoo | Orange | PCCW | PLDT |
| Proximus | Quebecor Telecommunications | Rakuten | Reliance Communications Limited | Reliance Jio | Rogers | Rostelecom | Safaricom Limited | Sasktel | Shaw |
| Singtel | SITI Networks Limited | SK Telecom | Sky plc | SmarTone | SoftBank | Spark New Zealand Limited | Sprint | StarHub | STC (Saudi Telecom) |
| SureWest Communications | Swisscom | Taiwan Mobile | Tata Communications | Tata Teleservices | TDC | TDS | Tele2 AB | Telecom Argentina | Telecom Egypt |
| Telecom Italia | Telefonica | Telekom Malaysia Berhad | Telenor | Telia | Telkom Indonesia | Telkom SA | Telstra | Telus | Thaicom |
| Time Warner | Time Warner Cable | TPG Telecom Limited | True Corp | Turk Telekom | Turkcell | Veon | Verizon | Virgin Media | Vivendi |
| Vodafone | Vodafone Idea Limited | VodafoneZiggo | Wind Tre | Windstream | Zain | Zain KSA | Ziggo | ||
| Masmovil Masorange |
Regional coverage:
| Asia | Americas | Europe | MEA |
Visuals