By Matt Walker
Summary
Economies across the globe remain ravaged by the COVID-19 pandemic, with high unemployment and steep declines in GDP. Yet webscale network operators (WNOs) reached all-time highs for a number of financial measures in 2Q20, including capital expenditures (capex), R&D expenses, and revenues. Free cash flow as a percent of revenues, or FCF margin, rose to 19.3% in 2Q20 on an annualized basis. That’s the highest since 4Q17. WNOs’ stockpile of cash and short-term investments reached $735 billion, up 11% YoY, and comfortably higher than WNO debt of $483 billion. Stock market valuations of key webscale players have climbed throughout the pandemic. The big are getting bigger, and fast.
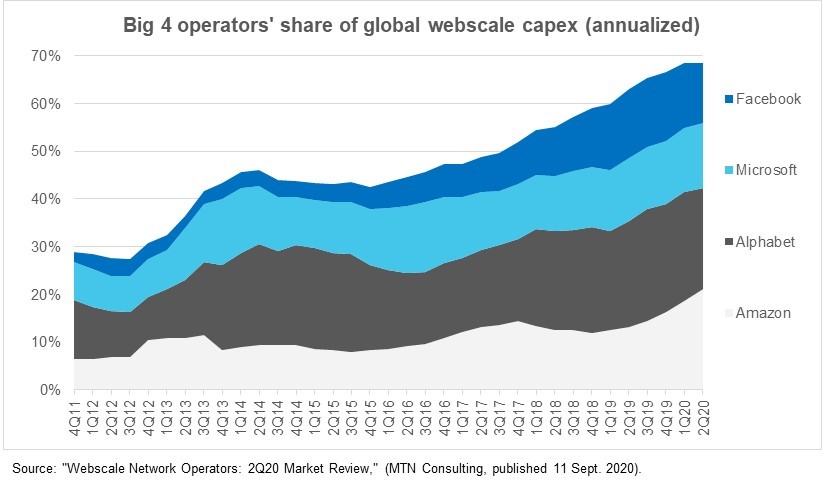
Focusing on network investments, annualized capex grew 9% YoY to hit $114.4 billion in 2Q20; the network/IT portion of capex amounts to 49.7% of the total. Capex is highly concentrated in the webscale sector. The top 4 WNOs – Alphabet, Amazon, Google, and Facebook – accounted for 68% of the market for the four quarters ended 2Q20. That’s up from 63% of total capex in the 2Q19 annualized period. These 4 companies’ share of network/IT-focused capex is similarly high. That has implications for all sorts of markets, including semiconductors. It shouldn’t be surprising that chip sector consolidation has picked up as webscale providers have grown more dominant. Granted, semiconductor companies sell into a wide range of end use markets, notably consumer electronics and transport. But webscale players have become much more influential buyers as their data center footprints have expanded. That’s true even though WNOs do self-design some chips and partner with foundries for manufacturing.
As WNOs have grown, they’ve developed more sophisticated offerings in the cloud, often targeting specific vertical markets with customized platforms, including telecom. This is impacting how telcos build their networks and develop services. In the last year, webscale partnerships with telcos have expanded, spanning workload shift, joint development, and service partnerships – often supporting 5G. In January, MTN Consulting flagged the need for more collaboration between telcos, WNOs, and carrier-neutral providers as essential for 5G success. That remains true. This trend tends to support telcos’ aim to lower their capex outlays, and explains a small part of the ongoing growth in webscale network spending.
The US-China tech rivalry has many implications for webscale sector development. Nearly all of the big webscale players are either American or Chinese, and the collective power of the two countries’ WNO players has grown over time. The WNO business is about scale and building leading edge networks and service platforms. Both American and Chinese WNOs, then, aim to have operations spanning the globe, first, and demand access to cutting edge technology and people skills. China’s webscale sector has developed amidst protectionism, where foreign players were highly restricted in their market access from the start. The U.S. is only now catching up with the China approach. At the beginning of 2020, Alibaba and Tencent already had significant network and R&D assets in the US, and market access with many of their platforms (e.g. Alipay, WeChat). They also have been able to build their networks with largely unrestricted access to technology which may have U.S. origins, such as Intel platforms or third party-designed chips manufactured by foundries such as TSMC. Much of this is changing.
- Table Of Contents
- Figure & Charts
- Coverage
- Visuals
Table Of Contents
- Summary (p2)
- Second quarter capex hits all-time high of $114B (p2)
- The big get bigger, with implications well beyond data centers and the cloud (p4)
- Telcos collaborating with webscale to their benefit, but not without some risk (p5)
- TikTok, WeChat and webscale tech development (p6)
- Capex outlook for 2H20 (p7)
- Appendix 1: Summary of webscale operators’ 2Q20 capex, R&D and cash positions (p8)
- Appendix 2: About MTN Consulting (p9)
Figure & Charts
Figures
Figure 1: Annualized capex and R&D spending: WNOs (% revenues)
Figure 2: Big 4 operators’ share of global webscale capex (annualized)
Figure 3: Tencent’s technology investment priorities
Figure 4: Summary of webscale operators’ 2Q20 capex, R&D and cash positions
Coverage
Organizations mentioned in this report include:
Alibaba
Alphabet
Amazon
AMD
Apple
Arm Holdings
AT&T
Baidu
Bharti Airtel
ByteDance
Cognizant
eBay
Etisalat
Facebook
Fujitsu
HPE
Huawei
IBM
Intel
JD.COM
Microsoft
NVIDIA
Oracle
Orange
Qualcomm
Samsung
SAP
SMIC
Softbank
Tencent
TikTok
TSMC
Verizon
Xiaomi
Yandex
Visuals


