By Matt Walker
In late 2023, MTN Consulting published an initial review of the relationship between traffic growth and energy consumption in telco networks. That review included data for 16 telcos, and focused on 2020-22 data. This updated analysis extends coverage to 30 telcos, and adds two years (2019 and 2023) of data. Our analysis now addresses the 2019-23 timeframe.
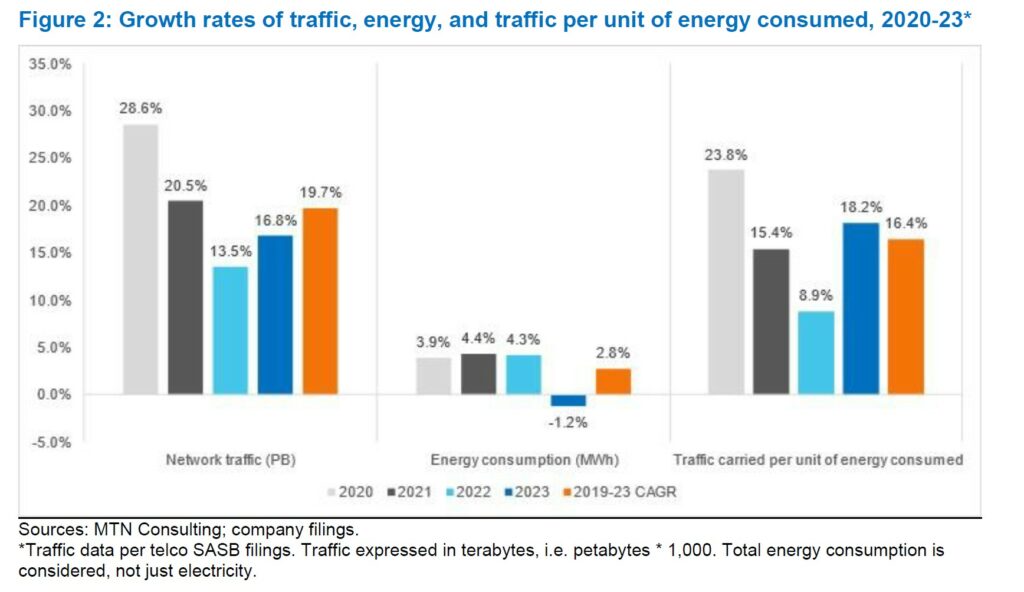
The group of 30 telcos included in this analysis represent about 55% of the global market, based on revenues. Our data verify the well-known revenue-traffic conundrum, where traffic rises faster than revenues: in 2023, the average telco carried 2.06 Petabytes of traffic per US$1M in revenue, over double the 1.00 Petabytes per $M carried in 2019. This is possible because telcos make constant improvements aimed at carrying traffic more cheaply. Energy is a big part of the cost story. So, are networks getting more efficient in their carriage of traffic per unit of energy consumed? In the 2019-23 timeframe, our group of 30 telcos increased network traffic at an average annual rate (CAGR) of 19.7%, while their total energy consumption grew at a CAGR of 2.8%. As a result, in 2023 the average telco consumed 90.0 MWh of energy per Petabyte of traffic, down from 165.5 MWh/PB in 2019. That works out to an annual average (CAGR) improvement in MWh per Petabyte of 14.1%. Meaning, on average, telcos need 14.1% less energy per year to carry the same traffic load as the prior year. This improvement is in line with the stated goal of both telcos and their vendors: to improve the network’s energy efficiency over time. The biggest improvements in the MWh/Petabyte metric since 2019 are BT, Entel, Rogers, Tele2, and Veon. The worst result came from Saudi Telecom (STC), which used 104 MWh/PB in 2023, from 90 in 2019. The poorest result in 2023 alone was reported by Vodafone, which improved (lowered) its MWh/PB ratio by just 3.8% YoY.
For climate change watchers, an important metric is greenhouse gas emissions (GHG), as measured in CO2 equivalent metric tons. We don’t address emissions in this report, but we did in a December 2024 report. That report found that telco emissions in 2023 were about the same level (per unit of revenue) as in 2019, and that renewables accounted for only about 20% of energy used in 2023. Both findings were disappointing. So, this current report’s conclusion is a welcome bit of good news.
Telco sustainability reports emphasize the importance of adopting energy efficient technologies and network designs. Vendors consider the energy efficiency of their solutions a crucial differentiator. As telcos attempt to lower energy costs and reduce their carbon footprints, vendors have an opportunity to support further improvements.
- Table Of Contents
- Figures and Tables
- Coverage
- Visuals
Table Of Contents
- Summary – page 1
- Telco network energy efficiency rising 14% per year – page 1
- Overview of the dataset – page 1
- The revenue-traffic conundrum persists – page 3
- Traffic carried per unit of energy consumed – page 3
- Vendors have a central role in sustaining improvements – page 5
- Conclusion – page 6
- Appendix – page 8
Figures and Tables
Table 1: Summary metrics for the “Group of 30” telcos
Figure 1: Petabytes of traffic on network per US$M in revenue, 2019-23*
Figure 2: Growth rates of traffic, energy, and traffic per unit of energy consumed, 2020-23*
Figure 3: Terabytes of traffic per MWh of energy consumed*
Coverage
Organizations mentioned:
A1 Telekom Austria
Advanced Info Service (AIS)
Airtel
Amdocs
America Movil
AT&T
Axiata
BT
Charter Communications
China Mobile
Cisco
Comcast
CommScope
Deutsche Telekom
Entel
Ericsson
Globe Telecom
KT
LG Uplus
Mobile Telesystems
Nokia
PLDT
Ribbon
Rogers
Singtel
SK Telecom
StarHub
STC (Saudi Telecom)
Sustainability Accounting Standards Board
Taiwan Mobile
Tele2 AB
Telefonica
Telenor
Veon
Verizon
Vodafone
Zain
Visuals