By Arun Menon
This report provides a deep dive into telco opex trends by category from 2016 to 2023, analyzing data from 32 companies across key regions.
Managing opex wisely is essential for telcos to thrive and grow profitability: in 2023, global telco revenues fell 0.5% YoY to $1,778.1B. That marks a decade-low, due to currency fluctuations, particularly in Japan, and limited 5G monetization opportunities. In addition to stagnant revenues, telcos face high capex demands and fierce competition, emphasizing the need for strategic cost optimization beyond traditional methods like asset sell-offs and outsourcing. Getting opex under control is key.
Key findings of our telco opex study include:
Total opex fell by 1.0% in 2023, but opex excluding depreciation and amortization (D&A) declined by 0.5%, or about the same rate of decline as revenues. The difference is D&A, which fell at the much steeper clip of 3% in 2023.
- Network-related opex, encompassing operations, leasing, utilities, and D&A, constitutes 50.8% of total opex, with significant company-specific variations.
- Network operations costs rose from 16.5% of opex in 2016 to 18.4% in 2023. Network leasing opex declined several years ago due to new accounting rules (IFRS 16) and are now steadily in the 3.0 to 3.5% range.
- Depreciation and amortization, the largest opex category, grew to 23.4% of opex in 2023.
- Labor costs, accounting for over 16% of opex, are rising as telcos compete for digital talent and embrace automation. As a percentage of total opex, labor costs increased from 16.2% in 2016 to 17.4% in 2023.
The report underscores the need for telcos to standardize opex tracking and implement transformative measures to enhance profitability. By benchmarking costs and uncovering inefficiencies, telcos and vendors can better navigate industry challenges and opportunities.
————————————
*Companies included: Advanced Info Service (AIS), Airtel, Batelco, BT, Charter Communications, China Mobile, Chunghwa Telecom, Du, Etisalat, Globe Telecom, KDDI, KPN, LG Uplus, Megafon, MTN Group, Oi, Ooredoo, Orange, PLDT, Proximus, Saudi Telecom (STC), Singtel, SK Telecom, Starhub, Swisscom, Tata Communications, Telecom Argentina, Telecom Italia, Telkom Indonesia, Telus, Turk Telekom, and Veon
- Table Of Contents
- Figure & Charts
- Coverage
- Visuals
Table Of Contents
- Report Highlights
- Abstract
- Results for Group of 32 Telcos
- Results by Company
- Taxonomy
- About
Figure & Charts
- Capex and Opex as % of Revenues – Group of 32
- Network-related capex and opex in 2016-23: Group of 32 (% revenues)
- Opex by category, 2016-23 average
- Network-related opex categories as % of total opex, 2016-23
- All network-related opex, % total
- Profit margins for group of 32 telcos, 2016-23 average
- Labor costs as a % of total opex
- Labor costs per employee (US$K)
- Opex items by company, % total opex: 2023
- Profitability margins by company, 2023
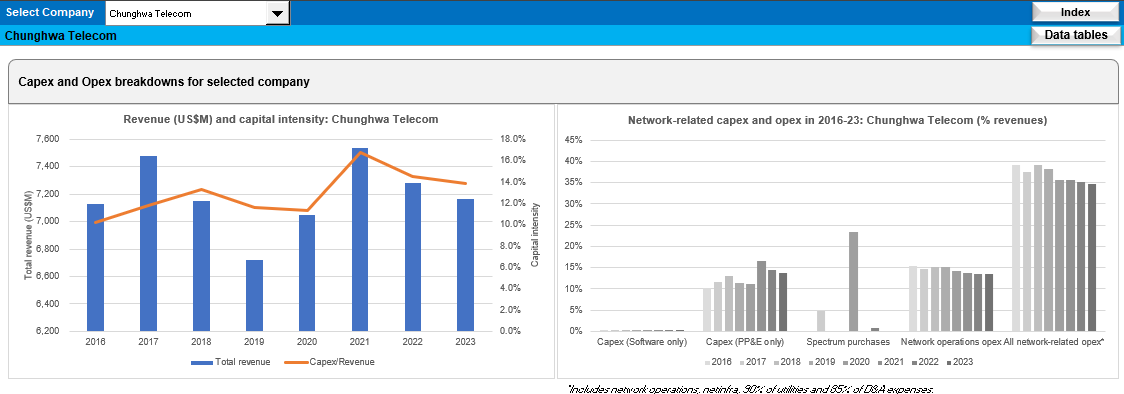
- Company-level revenue (US$M) and capital intensity
- Company-level network-related capex and opex in 2016-23
- Company-level opex by category, 2016-23 average
- Company-level network-related opex categories, as % of total opex, 2016-23
- Company-level all network-related opex as % of total opex
- Labor costs per employee (US$K): company vs. global telco average
- Labor costs as a % of total opex: company vs. global telco average
- Average profit margins, 2016-23: company vs. global telco average
- Company-level profitability trends, 2016-23
Coverage
Operator coverage:
| Advanced Info Service (AIS) |
| Airtel |
| Batelco |
| BT |
| Charter Communications |
| China Mobile |
| Chunghwa Telecom |
| Du |
| Etisalat |
| Globe Telecom |
| KDDI |
| KPN |
| LG Uplus |
| Megafon |
| MTN Group |
| Oi |
| Ooredoo |
| Orange |
| PLDT |
| Proximus |
| Saudi Telecom (STC) |
| Singtel |
| SK Telecom |
| Starhub |
| Swisscom |
| Tata Communications |
| Telecom Argentina |
| Telecom Italia |
| Telkom Indonesia |
| Telus |
| Turk Telekom |
| Veon |
Visuals


