By Matt Walker
This report reviews the growth and development of the webscale network operator (webscale, aka hyperscale) market since 2011. The webscale market consists of big tech providers building large networks of data centers as part of their operations. Our webscale tracker covers 22 companies. Coreweave is a new addition to our coverage, starting with this 4Q24 edition.
In 2024, webscalers represented $2.596 trillion (T) in revenues (+9.4% YoY), $314 billion (B) in R&D spending (+7.1% YoY), and $304B in capex (+55.5% YoY). They had $643B of cash and short-term investments (-5.3% YoY) on the books as of December 2024, and $545B in total debt (-3.4% YoY). The value of webscalers’ net plant, property & equipment (net PP&E) on the books as of December 2024 was $922B, up 28.3% YoY. Webscalers employed approximately 4.234 million (M) people at the end of 4Q24, up 1.2% from the Dec. 2023 total of 4.185M.
Below are highlights from the report:
Revenues: Single quarter revenues in 4Q24 were $745.3 billion (B), up 9.9% YoY. That pushed annualized revenues to $2.596 trillion. Topline growth has been driven by the big 4: Alphabet, Amazon, Meta (FB) and Microsoft. For six straight quarters, all of these companies have recorded double digit revenue growth. For the 4Q24 annualized period, among larger companies, the fastest growth came from Meta, up 21.9% versus 2023, followed by Microsoft (+15.0%), Alphabet (13.9%), and Amazon (11.0%). The biggest dollar impact on growth in 4Q24 came from Amazon, as its single quarter revenues grew $17.8 billion from 4Q23 to end 4Q24 at $187.8B, up 10.5% YoY. The only curbs on growth in 4Q24 were Japanese IT services & cloud vendor Fujitsu and Chinese search specialist Baidu, both of which reported modest declines.
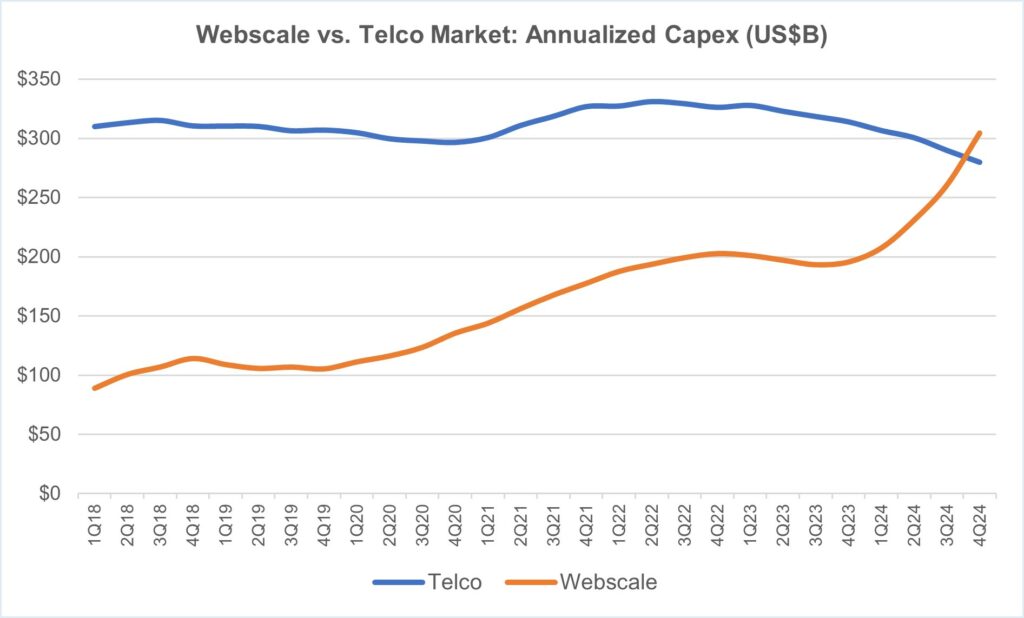
Capex: After declining 3% in 2023, webscale capex grew at incredibly fast, unsustainable rates in 2024: up by 26%, 53%, 61%, and 78% YoY in the four quarters of the year. 4Q24 capex of $100.2B pushed the annualized total to $304.4B, up 56% YoY, and another all-time high. Investor interest in generative AI has spread rapidly, driving GPU spend in the data center. Some companies claim they are struggling to procure all the GPUs they want, and prices are unusually high, both due to NVIDIA’s market power. The current investment spike would seem to be inspired by a mix of hype and fear of missing out, as GenAI brings with it a plethora of legal & regulatory risks and relative lack of proven business models. Most recent webscale capex is focused on outfitting existing data centers: from 48% of annualized capex in 2022, Network/IT and software capex was 60% of total capex in 2024. The biggest capex outlays in 4Q24 came from Amazon ($27.8B), Microsoft ($15.8B), Meta ($14.4B), and Alphabet ($14.3B). These four account for over 70% of single quarter spending. They are the reason behind the surge in the price of NVIDIA stock.
Profitability: Webscale free cash flow margins averaged out to 16.3% in 2024, a bit lower than the 18.6% average of 2023. Average net profit margin for 2024 was 19.9%, a bit higher than 17.5% in 2023. Net margins are around the same level as in the year before COVID, but free cash flow margins have dropped recently due to high capex spend. Meta, Tencent and Microsoft were 1-2-3 for FCF margins in 2024 overall. The ecommerce specialists Amazon and Alibaba are the laggards, as usual. In gauging webscalers’ ability to fund their capex, their recent levels of free cash flow profitability is one factor to consider. The overall level of average margins is a bit low relative to history, and it’s moving in the wrong direction. Webscalers can afford this for a few quarters, but not for a few years.
Employees: Headcount in the webscale market totaled to 4.23 million in December 2024, slightly up from 4.185 million in December 2023. This difference is negligible, considering the size of some of the webscalers and how quickly the ecommerce specialists in particular can change workforce levels. Total webscale headcount has been approximately 4.1 to 4.2 million or so steadily since late 2021. Some of the biggest webscalers are investing heavily in AI and GenAI, with one clear goal being to improve their internal cost efficiencies. This inevitably will mean fewer employees. Even within the ecommerce space, there is a rising use of robots and autonomous vehicles in the logistics chain. Per our latest forecast, we expect webscale employment to rise slightly in 2025 but decline thereafter due to greater use of robotics, automation and AI.
Regional trends: The Asia-Pacific region has been a drag on the market for several quarters, and that continued in 4Q24. Webscale revenues in the Americas, Europe, and MEA have been growing in the low double digit range for a few quarters, but AP has been weak: 4Q24 revenue growth was 6% YoY, in line with the last few quarters of low single digit percentage growth. Weak Asian currencies and a very competitive ‘big tech’ market in China account for the gap. Asia should have a good 2025, though. Both Tencent and Alibaba appear to have strong government support to expand and grow tech spending over the next 2-3 years. That should help to accelerate Asian regional growth.
- Table Of Contents
- Figures & Charts
- Coverage
- Visuals
Table Of Contents
- Report highlights
- Outlook
- Analysis
- Key Stats
- Company Drilldown
- Company Benchmarking
- Regional Breakouts
- Raw Data
- Exchange Rates
- About
Figures & Charts
- Key Metrics: Growth rates, Annualized 4Q24/4Q23 vs. 2021-24
- WNO Revenues: Single-quarter & annualized (US$M)
- Top 8 WNOs: YoY revenue growth in 4Q24
- Annualized profitability: WNOs
- Free cash flow per employee, 4Q24 annualized (US$)
- FCF Margins vs. Net Margins, 4Q24 annualized
- Advertising revenues as % total (FY2024)
- Annualized capex and R&D spending: WNOs (% revenues)
- WNO capex by type, Annualized: 4Q15-4Q24 (US$M)
- Network & IT capex as share of revenues, 4Q24 annualized
- R&D expenses as % revenues, Top 8 WNOs (4Q24 annualized)
- Acquisition spending vs. capex spending, annualized (US$M)
- Net PP&E per employee (US$’ 000) – 4Q24
- Ranking the Webscale Network Operators: Revenues; R&D; Capex; Network & IT capex – 2024 & 4Q24 (US$B)
- Annualized spending share for key webscalers since 2011 Capex: Network, IT and software
- Share of webscale spending by company, 4Q24 and 4Q23 annualized (Capex: Network, IT and software)
- Energy consumption vs. Net PP&E for key webscalers in 2024
- USA: Webscale capex total ($M) and % of global market, 2011-24
- Webscale vs. Telco Market: Annualized Capex (US$B)
- Webscale vs. Telco Market: Annualized capital intensity
- Revenues: annual, single-quarter, and annualized (US$M)
- Profitability (Net Profit; Cash from operations; Free cash flow): annual, single-quarter, and annualized (US$M)
- Spending (R&D; M&A; Capex; Network & IT capex; Lease): annual, single-quarter, and annualized (US$M)
- Cash & Short-term Investments: annual and single-quarter (US$M)
- Debt (Total debt; Net debt): annual and single-quarter (US$M)
- Property, Plant & Equipment: annual and single-quarter (US$M)
- Key Ratios: Net margin; R&D/revenues; Capex/revenues; Network & IT capex/revenues; Free cash flow/revenues; Lease costs/revenues – annual and annualized (%)
- Total employees
- Revenue per employee, annualized (US$K)
- FCF per employee, annualized (US$K)
- Net PP&E per employee, annualized (US$K)
- Revenues & Spending (US$M)
- Revenues (US$M) & YoY revenue growth (%), single-quarter: by company
- Revenues, annualized (US$M): by company
- Annualized profitability margins: by company
- Annualized capex and capital intensity: by company
- Annualized capex and R&D spending as % of revenues: by company
- Share of WNO network & IT capex, Annualized: by company
- Total employees: by company
- Annualized per-employee metrics (US$000s): by company
- Net debt (debt minus cash & stock) (US$M): by company
- Top 10 webscale employers in 4Q24: Global market
- Headcount changes in 4Q24 (YoY %): Global market
- Net PP&E: USA vs. RoW (by company)
- Net PP&E: total in $M and % global webscale market (by company)
- Energy consumption, MWh and % webscale total (by company)
- Share of webscale energy consumption, net PP&E, and capex (by company)
- Energy intensity relative to webscale average and select data center-focused CNNOs (by company)
- Energy intensity in webscale sector, 2024: MWh consumed per $M in revenue
- Capex/revenues (annualized): Company vs. Webscale average
- Revenue per employee (US$000s) (annualized): Company vs. Webscale average
- 2018 vs. 2024: company benchmark by KPI (Revenues, R&D, Net profit, Cash from operations, Capex, Free cash flow, Cash & short-term investments, Net PP&E, Total debt)
- 2018 vs. 2024: company benchmark by key ratio (Capex/revenues; R&D/revenues; Net margin; FCF margin)
- Top 8 WNO’s share vs. Rest of the market: by KPI (Revenues, R&D, Net profit, Cash from operations, Capex, Free cash flow, Cash & short-term investments, Net PP&E, Total debt)
- Top 8 WNOs benchmarking by Key ratio: Capex/revenues; R&D/revenues; Net margin; FCF margin)
- Total WNO Market Revenues, by region: Latest CY; Latest Quarter; Annual trend (2011-24); Single quarter (4Q15-4Q24 )
- WNO Market: Revenues, single-quarter (YoY % change)
- Regional revenues by operator: Latest CY; Latest Quarter; Annual trend (2011-24); Single quarter (4Q15-4Q24)
- Top 10 operators by region: Latest CY; Latest Quarter
Coverage
| Top 8 WNOs | |||
| Alibaba | Alphabet | Amazon | Apple |
| Baidu | Meta (FB) | Microsoft | Tencent |
| Other WNOs | |||
| Altaba | ChinaCache | Cognizant | eBay |
| Fujitsu | HPE | IBM | JD.com |
| Oracle | SAP | ||
| Yandex | Coreweave | ||
Visuals