Quantifying the energy cost savings from 2G/3G network shutdowns
With each passing day, the 2G and 3G layers of telcos’ mobile networks are looming as heavy loads on operating expenses (opex). That’s due to multiple issues but especially energy consumption and related costs. With the existence of a 4G layer in these networks and the coming, if not already deployed, energy-hungry 5G layer, such loads become even heavier. Even before 5G has become widespread, energy costs averaged to about 4% of telco opex in 2021, based on an MTN Consulting study.
Quantifying base station energy costs by generation
Many telcos publish data on their energy consumption, and sometimes provide breakdowns for different parts of the network. But there are no existing estimates on the specific impact of maintaining 2G/3G networks alongside 5G. This blog attempts to quantify the effect of these older 2/3G mobile networks on a typical telco’s energy bill.
To accomplish this, first, we need to have a closer look at overall electrical energy consumption for mobile telcos, and then break down this consumption into parts, identifying what portion of total energy relates to the base station and what parts of the base station consume the most energy.
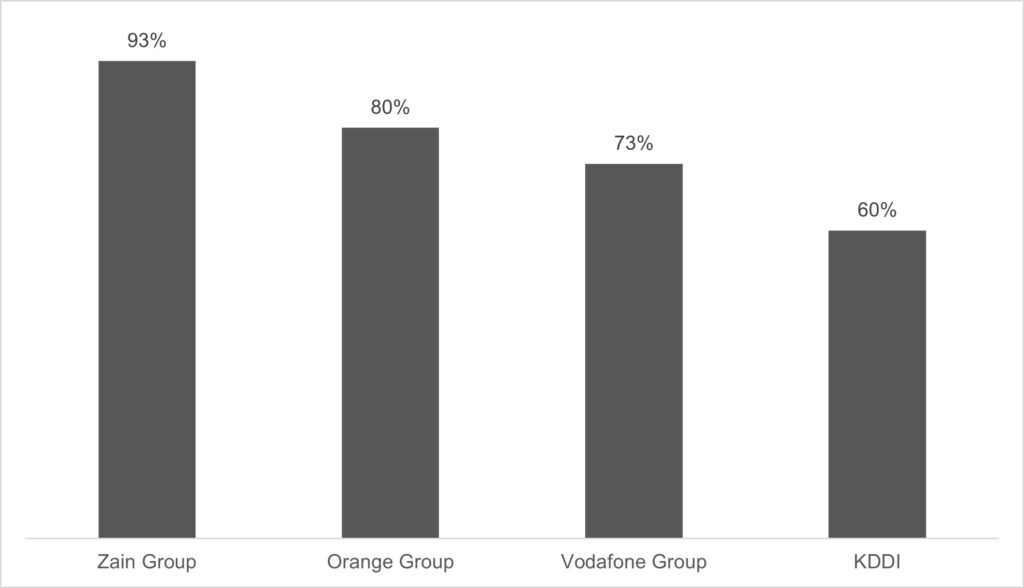
One complication is that a pure “mobile telco” is rare: most telcos providing mobile services also provide many other services, and operate network assets well beyond the mobile RAN. Some telcos providing mobile services began their lives long ago as fixed operators. Some started as mobile but acquired or built fixed assets to support converged offerings. Some have provided both fixed and mobile services from the start. Some provide cloud or other services mainly aimed at enterprise markets. The energy consumption patterns differ across operator types. Figure 1 illustrates this, for a few large telco groups.
Figure 1: Mobile network as % of total network usage, select telcos
Source: public reports and MTN Consulting estimates
To remove this confusion, we will consider mobile telecom companies that still rely exclusively on providing mobile telecom services. For such operators, the mobile network accounts for about 90% of total company energy consumption and costs. There is some limited variation around this 90% figure, due to vendor choice, network topology, and traffic mix, but 90% is a reasonable estimate.
Taking KDDI as an example from Figure 1, this company provides a range of services that are not mobile related; MTN Consulting estimates that KDDI’s mobile network accounts for only about 60% of total company energy consumption. But for Zain, this ratio is 93% as this company is almost exclusively focused on mobile services.
After concluding that about 90% of a mobile-only network provider’s energy consumption is from the mobile network, we need to dive deeper inside the mobile network to find the network elements that contribute most directly to energy consumption.
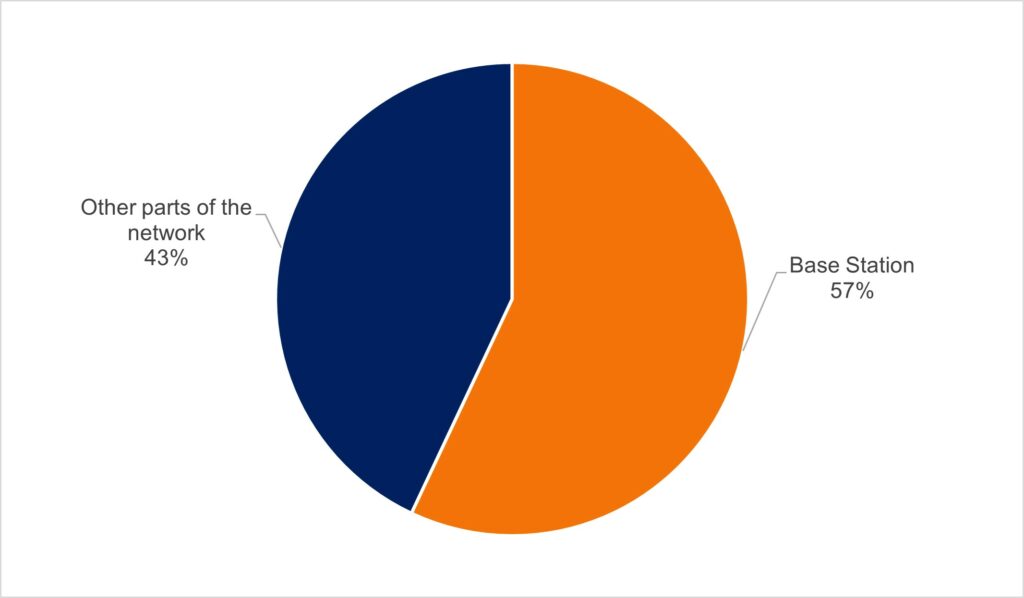
The mobile network consists of different parts like core, transport, and base stations. As shown in Figure 2, the base stations, or the mobile radio access network (mobile RAN), account for about 57% of network energy consumption for a mobile operator. Expressed differently, the mobile RAN accounts for about 51.3% (i.e. 90% * 57%) of total company energy consumption for a mobile-only operator, such as Zain.
Figure 2: Base station’s contribution to mobile network energy consumption
Source: IEEE Communications Surveys and Tutorials
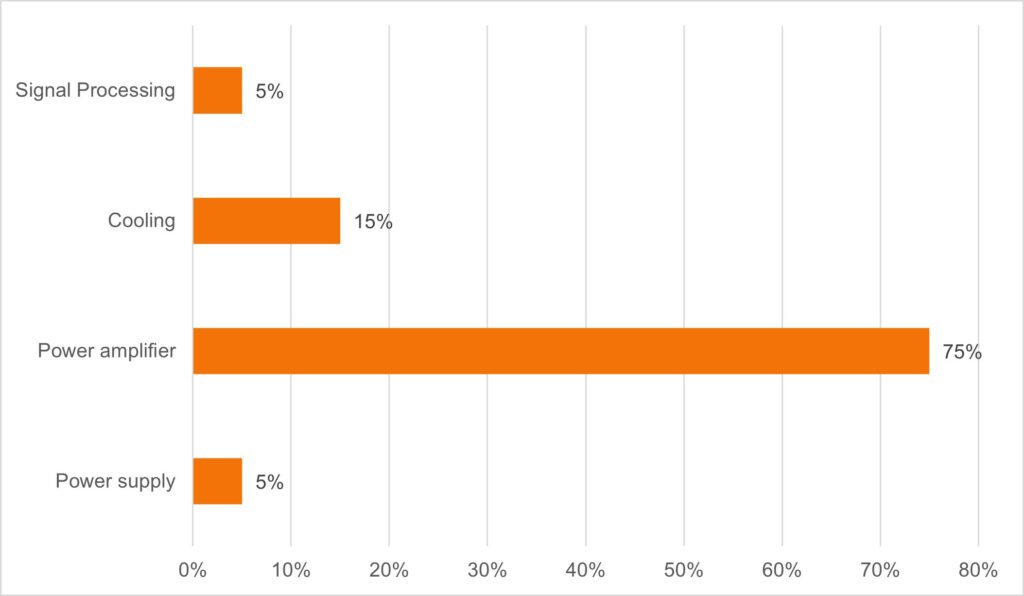
Now we need to examine the base station and have a closer look at the base station elements and their corresponding energy consumption. As shown in figure 3, the base station element that consumes the largest portion of energy is the power amplifier (PA), which consumes around 75% of total base station energy consumption as shown in figure 3.
Figure 3: Base station energy consumption distribution by network element
Source: Journal of Energy
As shown above, the power amplifier element is the biggest energy consumer in a mobile-only telco network. The power amplifier accounts for about 38% of total company energy consumption: 75% * 57% * 90%. So if a mobile network operator turns off the 2G network layer, the bulk of energy savings will come from shutting down the power amplifier that corresponds to the 2G network.
Now that we have quantified the amplifier’s contribution to total energy use, will this 38% figure be enough to measure the benefits of shutting down the 2G and 3G layers? Actually, we still need one more number: the energy consumption of the power amplifier for each technology. In other words, what is the energy consumption percentage for each of these technology layers? Let us have a look at this in Figure 4.
Figure 4 is a presentation of the key components in a base station and their typical energy consumption, in three different network configurations. The columns show the configuration of a typical base station, and the rows are the affecting elements, mainly the power amplifiers. The gray colored boxes are the elements needed for the 2G and the 3G layer, blue colored boxes are the elements needed for the 4G layer, green colored boxes are the elements needed for 2G, 3G, and 4G, and lastly, the orange colored boxes are elements needed for the 5G layer.
Figure 4: Energy consumption of key components in a base station, across three network configurations

Sources: MTN Consulting; Huawei Technologies
The values inside the elements represent the maximum energy consumption of that element. So as shown in figure 4, in 2G/3G only, the base station consumes 3.9kWh. By adding a 4G layer onto the base station, you increase the energy consumption of this base station by 51%. By adding a 5G layer on top of the 2G, 3G and 4G base station, you can expect another 66% increase in energy consumption. The red arrows in Figure 4 indicate these increases in maximum energy consumption.
That 66% figure illustrates one thing that is scary about 5G: yes, it may offer revenue upside, but it also consumes lots of power to operate 5G, which costs money and has climate impacts.
For this blog, though, what we really need to know is the contribution to total energy consumption of the legacy network elements as you upgrade to newer technology. These values are presented in figure 4 in the yellow arrows. So, in 2G/3G/4G base stations, about 40% additional energy is consumed by holding on to the 2G and the 3G layer. Similarly, in a combined 2G/3G/4G/5G base station, roughly 24% extra energy is consumed because of still holding the 2G and the 3G layers in this base station.
We now have the estimates we need to find the impact of supporting the 2G/3G network layers alongside 4G/5G for a typical mobile operator.
Approaches to 2G/3G network shutdowns vary depending on current network design
Right now telcos are wrestling with the best way to deal with legacy networks, while they upgrade to 5G. The ideal solution depends on the current position of the operator’s network. In the following table, you can see some potential paths to 2G/3G network shutdowns and the impact on energy consumption. In the first scenario, where the telco currently has only 2G and 3G network layers, an upgrade straight to 5G would result in an approximate 50% reduction in energy costs. In the last scenario shown on the bottom of the table, where an operator is simultaneously operating 2G, 3G, 4G, and 5G networks, the ideal solution is to shut down the 2G and 3G layers. This would save an estimated 40% in base station energy consumption.
Of course, energy costs are not the only factor in planning 2G/3G network shutdowns: spectrum, regulatory, legacy service revenue, and other factors also matter. But telcos nowadays are very focused on reducing their opex burden whenever possible, given weak revenue growth. As such, energy costs are a central focus of most telcos.
Table 1: Energy usage impact of 2G/3G shutdown scenarios
| Mobile network’s current scope | Likely migration path for 2G/3G shutdowns | % reduction in energy use for typical base station |
| 2G and 3G network | Upgrade straight to 5G, bypassing 4G, then shut down both 2G and 3G | 50.0% |
| 2G and 4G network | Upgrade to 5G then shut down the 2G layer | 30.1% |
| 3G and 4G network | Upgrade to 5G, then shut down the 3G layer | 33.2% |
| 2G, 3G and 4G network | Upgrade to 5G, then shut down both 2G and 3G layers | 39.9% |
| 3G, 4G and 5G network | After upgrading all sites to 5G, shut down the 3G layer | 33.2% |
| 2G, 4G and 5G network | After upgrading all sites to 5G, shut down the 2G layer | 30.1% |
| 2G, 3G, 4G and 5G network | The operator is ready to shutdown both the 2G layer and the 3G layers | 39.9% |
Source: MTN Consulting
The above table represents cost savings for the “typical” mobile-only telco we described early in the blog. In follow-up blogs, we expect to detail the impacts of 2G/3G network shutdowns for a few specific mobile operators in different regions of the world.
*
The author, Samir Ahmad, is a telecommunications and IT consultant based in Amman, Jordan. Samir has a Master’s in Telecommunication, Electrical, Electronics, and Communications Engineering, from the University of Sydney, and a B.S. in Electrical Engineering – Communications & Electronics, from the Jordan University of Science & Technology. Prior to entering the consulting field in 2017, Samir worked for Zain Jordan for 8+ years, most recently as Expert, RF Planning and Optimization.


